Municipal Credit Conditions Have Peaked, but Fundamentals Remain Strong
- Monthly state income tax collections in April indicate that the municipal market credit cycle has likely peaked, but most state and local governments have strong fiscal positions with ample reserves to manage the decline.
- We believe the decline in tax revenue is driven less by a deteriorating economy and more by a return to normal trends following unsustainable revenue growth in recent years.
- Robust rainy day funds will help plug FY23 and FY24 budget gaps, and most states are in a strong fiscal position powered by the robust post-pandemic recovery and unprecedented federal pandemic aid.
- Negative media headlines in the coming months may generate fear but also investment opportunities. Selectivity is critical, and we are cautious around issuers more vulnerable to secular risks.
Monthly state income tax collections sank in April, indicating the municipal market credit cycle has likely peaked. Yet the decline – which follows record high tax collections in the previous April – will, in our view, slow dramatically and can be well managed by most state and local governments that have amassed ample reserves. While security selectivity is critical, we expect a recession and state and local budget cuts to fuel outsize fear, creating attractive investment opportunities.
Income tax collections shrink
Almost all states saw income tax revenue shrink from April 2022, but the contraction was particularly noteworthy in Georgia, Illinois, Massachusetts, New Jersey, New York, and California. A drop in collections was widely anticipated amid a cooling economy and capital markets, yet the actual figures were worse than expected in several states, including California and New York. Both states are now forecasting current year or out-year budget deficits after enjoying large surpluses in recent years.
Yet it is important to put the recent slump in context. We believe current declines are driven less by a deteriorating economy, and more by a return to normal trends following unsustainable revenue growth in recent years. State revenues surged a record 20% in 2021 followed by nearly 14% growth in real terms early in 2022, with April 2022 collections representing a high-water mark for much of the sector.Footnote1 Figure 1 shows April 2023 collections shifted lower, bringing most states more in line with fiscal year 2019 and 2021 results.
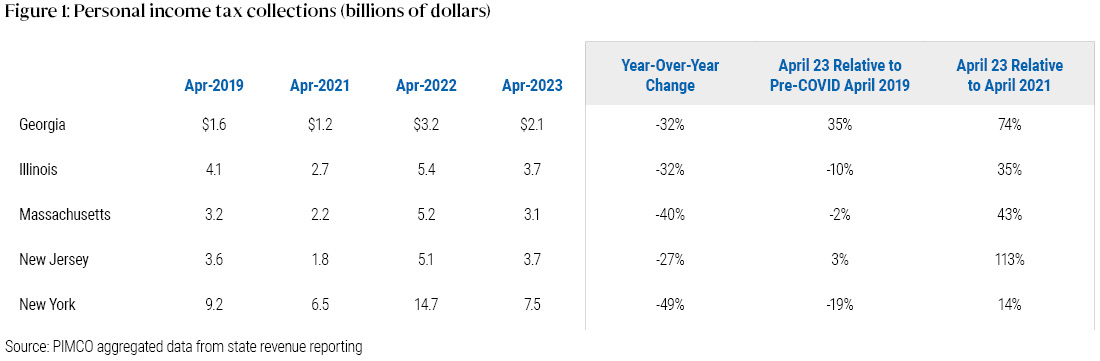
Illinois, for example, reported that April 2023 personal income tax revenues fell by a record one-third from 2022 to $3.7 billion – still among the strongest months on record. And like most states, it also relies heavily on other revenue sources that continue to perform relatively well, including sales taxes. The state’s total revenue collection of $6.2 billion was the second highest on record after April 2022, despite falling 23% from the previous April’s record high.Footnote2
Robust rainy day funds will help plug FY23 and FY24 budget gaps
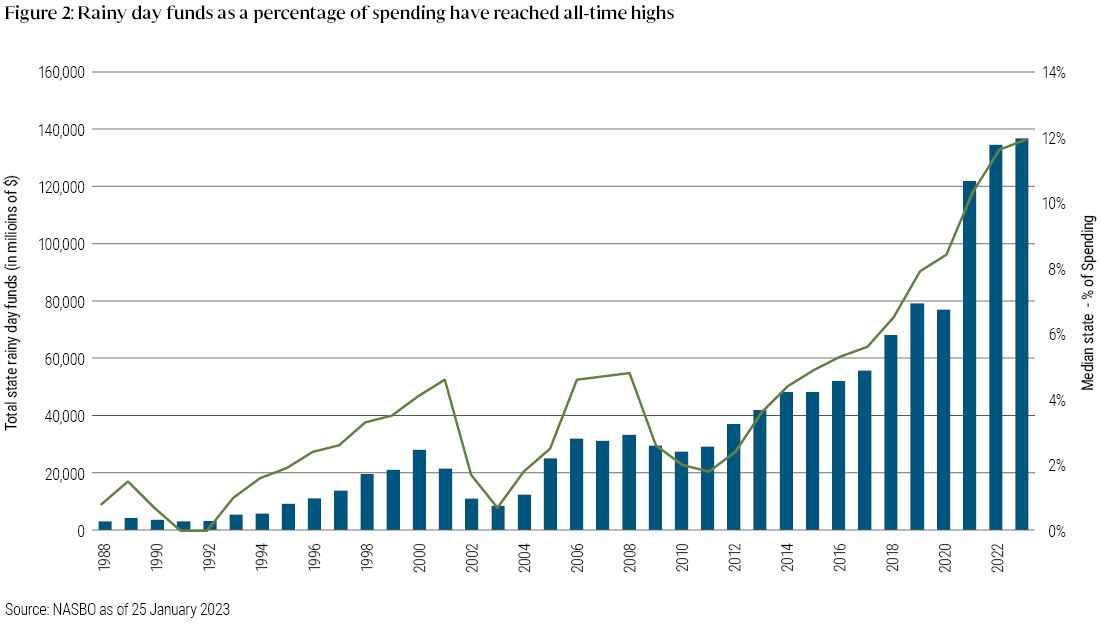
Most states are in a strong fiscal position, powered by the robust post-pandemic recovery and unprecedented federal pandemic aid. Budget reserves are at an all-time high. As such, states enter a possible recession better prepared than at any point in recent history, with reserves more than four times levels carried into the global financial crisis or GFC (see Figure 2). Rainy day funds are projected to reach 12% of spending in fiscal 2023 – a stark difference from past years when the median fell as low as 0%. These reserves create a sizable buffer against revenue volatility and will provide states time to enact changes (to revenues or expenditures) to balance their budgets.
Doubting the elevated 2021/22 tax revenues would last, many states built budgets that included large discretionary one-time spending capable of being pulled back if needed. Last year, California included more than $40 billion of its projected 2023 $100 billion budget surplus for new one-off spending; this included accelerated capital spending, pilot projects, and grant programs that can be cut more easily than structural spending such as public education or correctional programs. Trimming from these more discretionary areas enabled the state to close its projected budget deficits with little or no planned use of its $42 billion in rainy day reserves, keeping them intact for what could be stormier days ahead.
We expect rating upgrades to slow, but no meaningful acceleration of downgrades for investment grade credit
With solid fiscal positions, we don’t expect recent declines in tax revenue will trigger a meaningful acceleration of credit rating downgrades for state or local governments. Instead, we think the recent wave of upgrades will plateau. In the first quarter of 2023, Moody’s upgraded three times as many U.S. public finance credits than it downgraded, including those of lower-rated states such as New Jersey and Illinois. The upgrades across rating agencies for many states are only now petering out. While Moody’s did move the State of California’s outlook to negative in May, we expect it to be slow to downgrade the state as they monitor revenues and budget gaps. We also expect California to be somewhat of an outlier for the sector given its notoriously volatile revenues that are heavily correlated to capital gains performance.
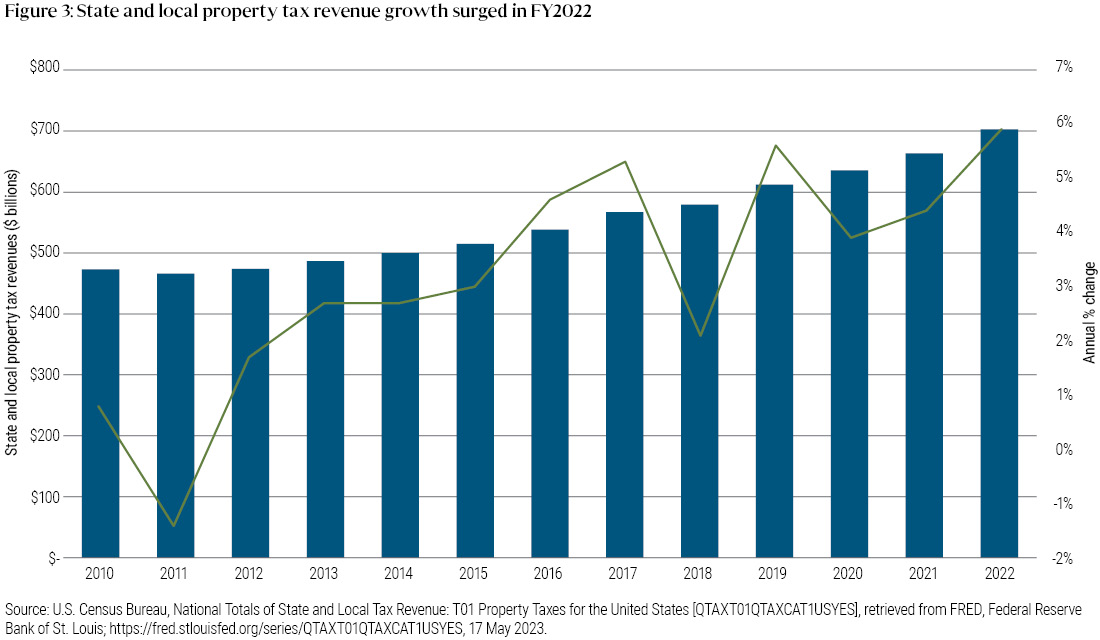
Local governments have seen similar upgrade momentum, even in cities like New York and Chicago that have projected budget deficits. Many have used unprecedented federal fiscal relief and better-than-expected tax collections to boost their reserves, and will likely benefit from the relative stability of property tax revenues.
Additionally, rating stress tends to lag the onset of a recession, partly because downgrades tied to audited financial results are typically released six to 12 months after the close of a fiscal year. Looking back at the GFC, public finance downgrades did not hit their peak until 2012, well after a broader economic recovery had begun.
Negative headlines may drive opportunities
Though credit fundamentals remain broadly strong for municipals, we expect negative media headlines in the coming months may generate fear and, in turn, investment opportunities. Unlike corporate credit issuers, municipalities must publicly debate their fiscal choices. As budget austerity takes hold, governors and mayors will come under pressure to make cuts in popular areas like education, healthcare, and transportation. Talks of budget cuts often spark debates in the media that fan investor fears and spur selling, which we believe will lead to investing opportunities.
Selectivity is critical, however. While we believe that the vast majority of high-grade municipals will weather our baseline forecast for a recession, we remain cautious around issuers whose credit quality may be hurt by secular risks including demographic shifts, stagnating return to office trends, and uncertain commercial property valuations.
1 Tax Policy Center: State and Tax Economic Review, 2022 Quarter 4: https://www.taxpolicycenter.org/publications/state-tax-and-economic-review-2022-quarter-4 Return to content
2 State of Illinois, Commission on Government Forecasting and Accountability: April Monthly Briefing: https://cgfa.ilga.gov/Upload/423%20Monthly.pdf Return to content
Featured Participants
Disclosures
This material is being provided for informational purposes only and does not constitute an offer to sell or a solicitation of an offer to buy interests in a fund or any other PIMCO trading strategy or investment product. The views expressed are as of the date recorded, and may not reflect recent market developments.
All investments contain risk and may lose value. Income from municipal bonds is exempt from U.S. federal income tax and may be subject to state and local taxes and at times the alternative minimum tax; a strategy concentrating in a single or limited number of states is subject to greater risk of adverse economic conditions and regulatory changes. Investing in the bond market is subject to risks, including market, interest rate, issuer, credit, inflation risk, and liquidity risk. The value of most bonds and bond strategies are impacted by changes in interest rates. Bonds and bond strategies with longer durations tend to be more sensitive and volatile than those with shorter durations; bond prices generally fall as interest rates rise, and low interest rate environments increase this risk. Reductions in bond counterparty capacity may contribute to decreased market liquidity and increased price volatility. Bond investments may be worth more or less than the original cost when redeemed. High yield, lower-rated securities involve greater risk than higher-rated securities; portfolios that invest in them may be subject to greater levels of credit and liquidity risk than portfolios that do not. The credit quality of a particular security or group of securities does not ensure the stability or safety of the overall portfolio. The quality ratings of individual issues/issuers are provided to indicate the credit-worthiness of such issues/issuer and generally range from AAA, Aaa, or AAA (highest) to D, C, or D (lowest) for S&P, Moody’s, and Fitch respectively.
Statements concerning financial market trends or portfolio strategies are based on current market conditions, which will fluctuate. There is no guarantee that these investment strategies will work under all market conditions or are appropriate for all investors and each investor should evaluate their ability to invest for the long term, especially during periods of downturn in the market. Outlook and strategies are subject to change without notice.
PIMCO does not provide legal or tax advice. Please consult your tax and/or legal counsel for specific tax or legal questions and concerns. The discussion herein is general in nature and is provided for informational purposes only. There is no guarantee as to its accuracy or completeness. Any tax statements contained herein are not intended or written to be used, and cannot be relied upon or used for the purpose of avoiding penalties imposed by the Internal Revenue Service or state and local tax authorities. Individuals should consult their own legal and tax counsel as to matters discussed herein and before entering into any estate planning, trust, investment, retirement, or insurance arrangement.
This material contains the current opinions of the manager and such opinions are subject to change without notice. This material is distributed for informational purposes only and should not be considered as investment advice or a recommendation of any particular security, strategy or investment product. Information contained herein has been obtained from sources believed to be reliable, but not guaranteed.
PIMCO as a general matter provides services to qualified institutions, financial intermediaries and institutional investors. Individual investors should contact their own financial professional to determine the most appropriate investment options for their financial situation. This is not an offer to any person in any jurisdiction where unlawful or unauthorized. | Pacific Investment Management Company LLC, 650 Newport Center Drive, Newport Beach, CA 92660 is regulated by the United States Securities and Exchange Commission. | PIMCO Europe Ltd (Company No. 2604517, 11 Baker Street, London W1U 3AH, United Kingdom) is authorised and regulated by the Financial Conduct Authority (FCA) (12 Endeavour Square, London E20 1JN) in the UK. The services provided by PIMCO Europe Ltd are not available to retail investors, who should not rely on this communication but contact their financial adviser. | PIMCO Europe GmbH (Company No. 192083, Seidlstr. 24-24a, 80335 Munich, Germany), PIMCO Europe GmbH Italian Branch (Company No. 10005170963, Corso Vittorio Emanuele II, 37/Piano 5, 20122 Milano, Italy), PIMCO Europe GmbH Irish Branch (Company No. 909462, 57B Harcourt Street Dublin D02 F721, Ireland), PIMCO Europe GmbH UK Branch (Company No. FC037712, 11 Baker Street, London W1U 3AH, UK), PIMCO Europe GmbH Spanish Branch (N.I.F. W2765338E, Paseo de la Castellana 43, Oficina 05-111, 28046 Madrid, Spain) and PIMCO Europe GmbH French Branch (Company No. 918745621 R.C.S. Paris, 50–52 Boulevard Haussmann, 75009 Paris, France) are authorised and regulated by the German Federal Financial Supervisory Authority (BaFin) (Marie- Curie-Str. 24-28, 60439 Frankfurt am Main) in Germany in accordance with Section 15 of the German Securities Institutions Act (WpIG). The Italian Branch, Irish Branch, UK Branch, Spanish Branch and French Branch are additionally supervised by: (1) Italian Branch: the Commissione Nazionale per le Società e la Borsa (CONSOB) (Giovanni Battista Martini, 3 - 00198 Rome) in accordance with Article 27 of the Italian Consolidated Financial Act; (2) Irish Branch: the Central Bank of Ireland (New Wapping Street, North Wall Quay, Dublin 1 D01 F7X3) in accordance with Regulation 43 of the European Union (Markets in Financial Instruments) Regulations 2017, as amended; (3) UK Branch: the Financial Conduct Authority (FCA) (12 Endeavour Square, London E20 1JN); (4) Spanish Branch: the Comisión Nacional del Mercado de Valores (CNMV) (Edison, 4, 28006 Madrid) in accordance with obligations stipulated in articles 168 and 203 to 224, as well as obligations contained in Tile V, Section I of the Law on the Securities Market (LSM) and in articles 111, 114 and 117 of Royal Decree 217/2008, respectively and (5) French Branch: ACPR/Banque de France (4 Place de Budapest, CS 92459, 75436 Paris Cedex 09) in accordance with Art. 35 of Directive 2014/65/EU on markets in financial instruments and under the surveillance of ACPR and AMF. The services provided by PIMCO Europe GmbH are available only to professional clients as defined in Section 67 para. 2 German Securities Trading Act (WpHG). They are not available to individual investors, who should not rely on this communication. | PIMCO (Schweiz) GmbH (registered in Switzerland, Company No. CH-020.4.038.582-2, Brandschenkestrasse 41 Zurich 8002, Switzerland). The services provided by PIMCO (Schweiz) GmbH are not available to retail investors, who should not rely on this communication but contact their financial adviser. | PIMCO Asia Pte Ltd (Registration No. 199804652K) is regulated by the Monetary Authority of Singapore as a holder of a capital markets services licence and an exempt financial adviser. The asset management services and investment products are not available to persons where provision of such services and products is unauthorised. | PIMCO Asia Limited is licensed by the Securities and Futures Commission for Types 1, 4 and 9 regulated activities under the Securities and Futures Ordinance. PIMCO Asia Limited is registered as a cross-border discretionary investment manager with the Financial Supervisory Commission of Korea (Registration No. 08-02-307). The asset management services and investment products are not available to persons where provision of such services and products is unauthorised. | PIMCO Investment Management (Shanghai) Limited. Office address: Suite 7204, Shanghai Tower, 479 Lujiazui Ring Road, Pudong, Shanghai 200120, China (Unified social credit code: 91310115MA1K41MU72) is registered with Asset Management Association of China as Private Fund Manager (Registration No. P1071502, Type: Other). | PIMCO Australia Pty Ltd ABN 54 084 280 508, AFSL 246862. This publication has been prepared without taking into account the objectives, financial situation or needs of investors. Before making an investment decision, investors should obtain professional advice and consider whether the information contained herein is appropriate having regard to their objectives, financial situation and needs. | PIMCO Japan Ltd, Financial Instruments Business Registration Number is Director of Kanto Local Finance Bureau (Financial Instruments Firm) No. 382. PIMCO Japan Ltd is a member of Japan Investment Advisers Association, The Investment Trusts Association, Japan and Type II Financial Instruments Firms Association. All investments contain risk. There is no guarantee that the principal amount of the investment will be preserved, or that a certain return will be realized; the investment could suffer a loss. All profits and losses incur to the investor. The amounts, maximum amounts and calculation methodologies of each type of fee and expense and their total amounts will vary depending on the investment strategy, the status of investment performance, period of management and outstanding balance of assets and thus such fees and expenses cannot be set forth herein. | PIMCO Taiwan Limited is an independently operated and managed company. The reference number of business license of the company approved by the competent authority is (112) Jin Guan Tou Gu Xin Zi No. 012. The registered address of the company is 40F., No.68, Sec. 5, Zhongxiao East Rd., Xinyi District, Taipei City 110, Taiwan (R.O.C.), and the telephone number is +886 2 8729-5500. | PIMCO Canada Corp. (199 Bay Street, Suite 2050, Commerce Court Station, P.O. Box 363, Toronto, ON, M5L 1G2) services and products may only be available in certain provinces or territories of Canada and only through dealers authorized for that purpose. | PIMCO Latin America Av. Brigadeiro Faria Lima 3477, Torre A, 5° andar São Paulo, Brazil 04538-133. | No part of this publication may be reproduced in any form, or referred to in any other publication, without express written permission. PIMCO is a trademark of Allianz Asset Management of America LLC in the United States and throughout the world. ©2023, PIMCO.
CMR2023-0602-2935605